
Debugging an application should be a lot nicer than putting echo statements throughout it. The Xdebug extension for PHP provides standard debugging capabilities, such as stepping through a program, and provides integration with IDEs that you already use.
This guide will show you how to set up remote debugging over SSH, which is handy if you need to connect to your system over the internet, and provides a secure link transparently. This approach provides security while being fairly easy to use. We also document additional approaches for situations where security is less of a concern.
Setting up Xdebug
If you’re using Seiden PHP+, you can install Xdebug in a single step, if it’s not already installed:
yum install php-xdebug
Xdebug is disabled by default, because it impacts performance. To enable Xdebug, uncomment the directive that loads Xdebug in the INI file for Xdebug, which can be found at /QOpenSys/etc/php/conf.d/99-xdebug.iniso that the directive looks like:
zend_extension=xdebug
Then restart the web server. Likewise, additional lines can be added to configure Xdebug. These will be explained more below and on the Xebug web site.
Enabling remote debugging
You can append the following lines to your Xdebug INI file:
; for remote debugging
xdebug.mode=debug
xdebug.client_host=127.0.0.1
xdebug.client_port=9003
Each setting explained:
xdebug.mode: Xdebug should enable remote debugging. Whenever it needs to debug something, Xdebug connects to a debugger listening for it. You can enable other Xdebug modes by separating them with a comma. For example, you can specify both develop and debug mode.xdebug.client_host: The computer to connect to.xdebug.client_port: The port on the computer to connect to. Most tools expect port 9003 (the new default in Xdebug 3) or 9000 (the old default in Xdebug 2), so it’s recommended to leave it here.
Setting the host to 127.0.0.1 (localhost/loopback) tells Xdebug to connect back to the same computer running Xdebug (the IBM i). This won’t work without an Xdebug debugger running on your IBM i, so we can create an SSH tunnel that listens on the Xdebug port on your IBM i and relays back to the Xdebug port on your computer.
If you are on a LAN with your IBM i, you could safely specify the IP of your local computer and count on the IP being consistent, as well as safe to connect to, but still limited, because that’s only one computer. If you are not on a LAN with your IBM i, you will probably connect using SSH.
Connecting over SSH
Make sure SSH is set up properly before connecting.
Now set up your tunnel using either OpenSSH or Putty.
OpenSSH Tunnel
If you use OpenSSH, you can use the -R flag to create a tunnel from your remote system to your local computer. The argument is given in the format of (port on remote computer):(address on local computer):port on local computer). For example, to connect port 9003 on the remote system to port 9003 on your computer:
ssh -R 9003:127.0.0.1:9003 user@ibmi
PuTTY Tunnel
In the “Tunnels” section of the PuTTY session preferences, (under Connection, SSH) add a remote tunnel with the following settings (for example, using port 9000 instead of 9003 if using Xdebug 2, or if you changed the listening port):
- Port: 9003
- Destination: 127.0.0.1:9003
- Type: Remote
Then click add. See the screenshot below for an example using port 9000:

PuTTY Xdebug SSH tunnel
Troubleshooting SSH
You should leave any sessions with the port open; disconnecting them will end the tunnel. If you run into connection issues, restarting the SSH connection may help.
Toggling debugging on
Xdebug will only connect to the debugger when told to. There are a few ways to do this:
- Through the GET/POST variables, or a cookie, for
XDEBUG_SESSION_START=, where session can be anything unique.- For example for a GET,
testdb2.php?XDEBUG_SESSION_START=WEB
- For example for a GET,
- Through setting an environment variable, appropriate for CLI.
- For example,
export XDEBUG_CONFIG="=" - (The
part is an IDE key, which can be anything, and is used to identify multiple users if you use the Xdebug proxy, which isn’t covered here. Thepart is the session, which is as above, is unique.
- For example,
Using your IDE
PhpStorm

PhpStorm Debugger
In PhpStorm, there are some things you should be aware of:
- Accepting incoming debugging requests should be on.
-

PhpStorm Listening for PHP Debug Connections
- You might also want to turn on the breakpoint for the first line.
-
- You probably want to establish a project mapping. At minimum, the file you want to debug should be in an opened project.

If you run into issues with connecting, make sure PhpStorm is listening on the right port. By default, PhpStorm will listen on 9000 and 9003.
If you run into issues with PhpStorm not being able to step or use breakpoints, make sure the mapping is set correctly. In the “Debugger” palette window, in addition to breakpoints, frames, and variables, it will tell you when the mapping is incorrect and preventing PhpStorm from debugging properly.
Eclipse PDT and Zend Studio
The Eclipse PHP Development Tools provides PHP functionality in Eclipse. Eclipse can be downloaded with PDT bundled, Zend Studio has Eclipse PDT integrated, and PDT can be installed into RDi.
In the preferences window (available from the application or Window menu, depending on platform), select the page for PHP -> Debug -> Installed Debuggers.

Installed Debuggers in Zend Studio
Change the settings on Xdebug, and change the port to match your version of Xdebug and enable listening. If set to “prompt”, Zend Studio will ask before accepting the debug session.

Configuring Xdebug in Zend Studio
You may also need to select a server to debug with; this specifies useful things like the path mappings (so it can pick the appropriate file on both ends). A generic server should work.

PHP Debug settings in Zend Studio

PHP Servers in Zend Studio

PDT edit server path mapping tab

PDT path mapping
Note for using PDT with RDi
Note that if you’re using the Eclipse PDT extension with Rational Developer for i, you will want to create PHP projects in the workspace. The RDi Systems Explorer does not create things in the workspace, and using the RDi explorer’s file system filters will instead create things in an invisible temporary directory in the workspace.
RDi perspective toolbar

Adding perspectives in RDi
For an easy way to manage things in the Eclipse workspace like projects, we recommend changing the perspective to the PHP one. Add a new perspective from the perspective toolbar (add is the first item on it), select PHP, and it will become available.

Example PHP Explorer view
You will want to create a new project mapped to a source directory for Eclipse’s sake. Now that the object in the workspace exists, you can select it from the path mapping dialog. Again, note that the remote system explorer entries from RDi are not available here.
Visual Studio Code
Install the PHP Debug extension, like below.
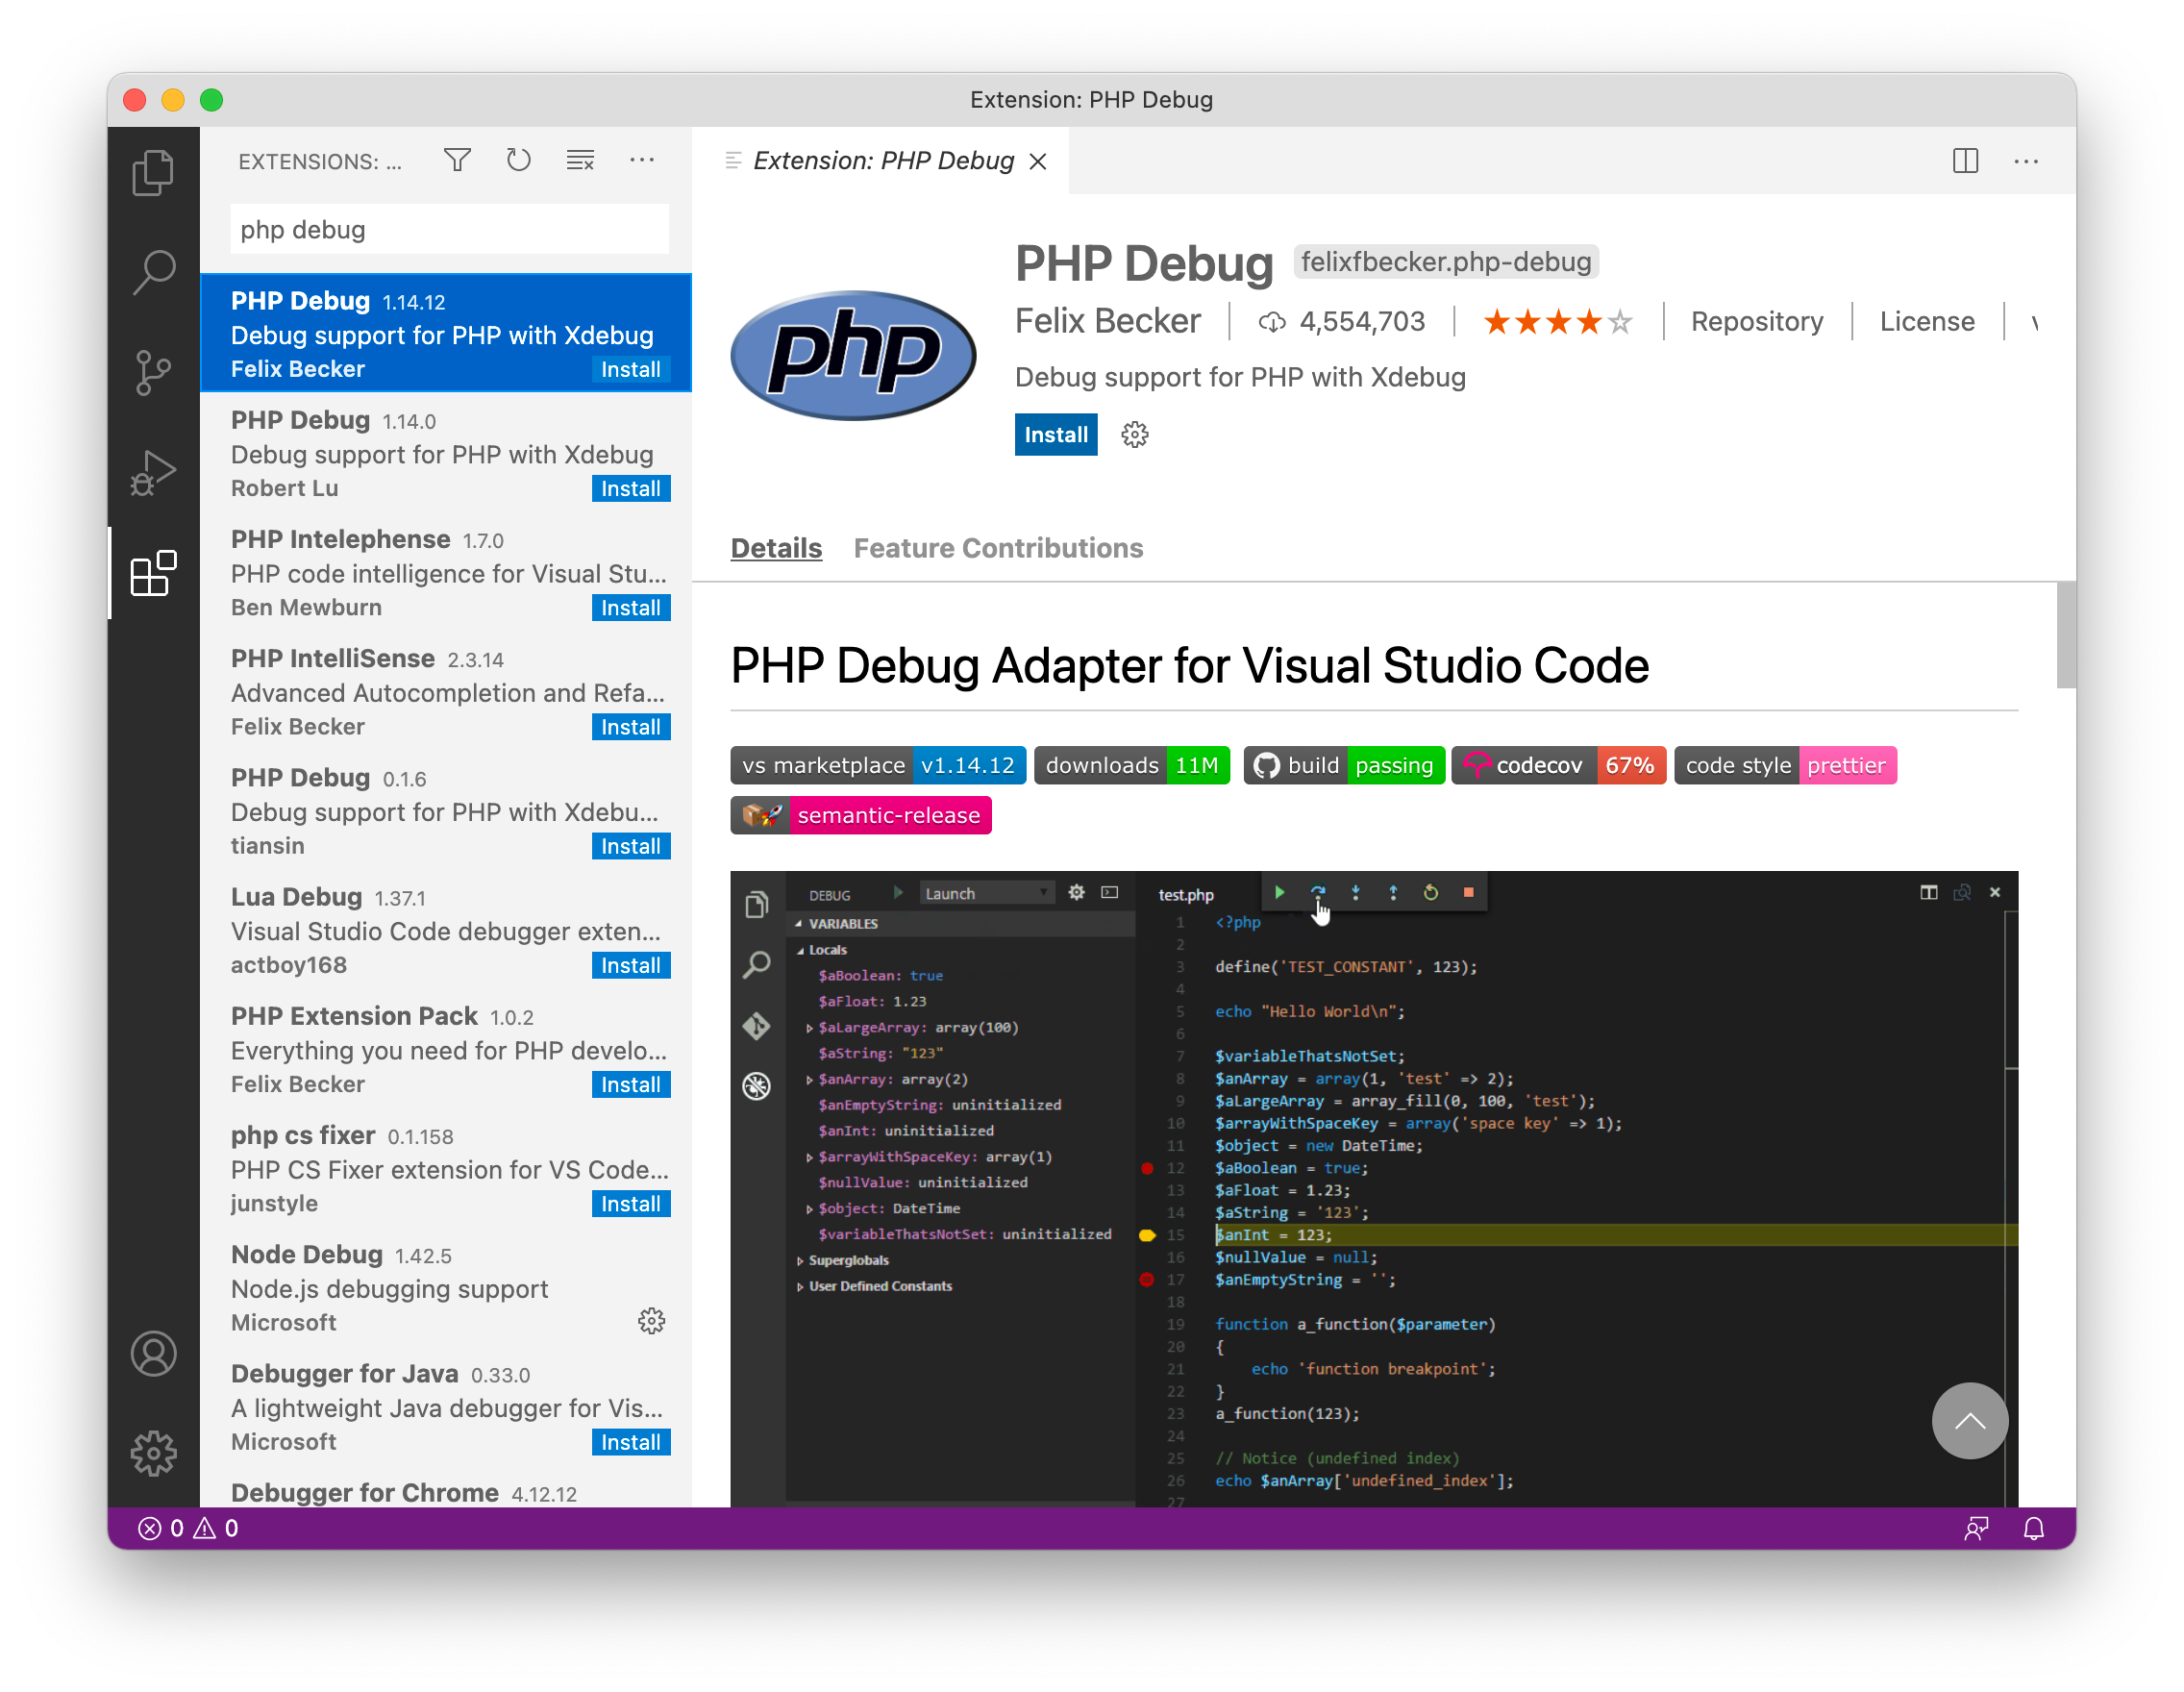
Installing the PHP Debug extension in Visual Studio Code
Your workspace should have a .vscode/launch.json file with contents similar to this, adjusted to match your site and configuration:
{
  "version": "0.2.0",
  "configurations": [
    {
      "type": "php",
      "port": 9003,
      "request": "launch",
      "name": "Listen for Xdebug",
      "pathMappings": {
        "/www/seidenphp/htdocs": "${workspaceFolder}"
      }
    }
  ]
}
The path mapping can either point to a local directory (with path expansions possible for i.e. the workspace folder) on your computer, or to a virtual filesystem path. For example, to use Code for i, you can specify a mapping of "/": "streamfile:/", and the current connection to the IBM i will be used for all paths the debugger receives. SSHFS can also be used, i.e. "ssh://host/path/to/dir".
When you hit start debugging with this launch configuration, the IDE will be listening for connections from the debugee.

Debugging PHP in Visual Studio Code
Vim with Vdebug

Vdebug
Vdebug is an Xdebug compatible debugger for Vim. When loaded, just press F5 and it’ll wait for a connection from Xdebug. When it connects, the debugger view will open. Check the Vdebug documentation for how to take advantage of Vdebug.
You’ll likely have paths that aren’t exactly the same on both ends. If so, you can create a mapping like so:
:let g:vdebug_options.path_maps = {"/ibmi/parsetest": "/mypc/src/parsetest"}
Troubleshooting debugger connections
If you’re having difficulty having Xdebug connect back to your debugger, you can log the connection attempts Xdebug makes. Set xdebug.log to a file that the web server or PHP-CLI user can write to, and have it make a debugger connection. Xdebug will log what it tried to connect to and any messages sent between it and the debugger. Because the logs are verbose, you might want to disable logging once you’re done troubleshooting.
Appendix: Debug proxy
Xdebug offers a proxy to route requests to different computers depending on the IDE key. This isn’t covered because it won’t run on IBM i (because it’s written in Go). If you have another server, you might find it useful to point Xdebug to the proxy and set up indiviual entries to each computer.
Appendix: Connect back
The xdebug.discover_client_host option will make Xdebug connect back to the IP that connected to the web server (even accommodating for a reverse proxy), instead of the remote host specified (The remote host/port can be omitted in that case.). This is useful for multiple developers on a LAN, but provides no security; anyone who can connect to the web server can debug. Use this only for restricted-access development web servers, like on a LAN.
Appendix: Debugging CLI programs
You can debug a CLI program by starting Xdebug on the request; for example, by adding the flags on a configuration without Xdebug:
# The important part is making sure the host and port match what's listening for debugging.
# The IDE, of course, needs the proper path mapping and listening.
# If the INI you're loading from has the desired Xdebug values,
# all you'll likely need to add is xdebug.start_with_request=yes
php -d zend_extension=xdebug -d xdebug.mode=debug -d xdebug.client_host=127.0.0.1 -d xdebug.client_port=9003 -d xdebug.start_with_request=yes script.php
Appendix: Xdebug Cloud
Xdebug Cloud offers a network-configuration free way to set up a debug connection. It uses a proxy-as-a-service Just add the token in the PHP configuration, add the token to your IDE (PhpStorm and VS Code supported). We recommend it for anyone who needs to debug code and isn’t on the same network as the system, and wants to avoid the tunnel limitations.
Consule the Xdebug Cloud documentation on how to set it up.
References
These references cover many more debugging options. They might be written from the local or LAN perspectives, however.
- All settings, Xdebug
- DBGp Proxy Tool, Xdebug
- Step Debugging, Xdebug
- Upgrading from Xdebug 2 to 3, Xdebug
- Configure Xdebug, JetBrains
- Remote debugging via SSH tunnel, JetBrains
- Zero-configuration debugging, JetBrains
IBM i Development
- RPG, COBOL, SQL, Node, PHP, Python, Valance, etc.
- Modernization. Integration.
- Web and API Solutions
- Legacy Maintenance ...
(or call 201.447.2437)

Got PHP Issues? GET ANSWERS!
Your PHP should be trouble-free. If your current PHP environment is anything less than perfect, we can help!
